Data Analyst Interview Questions: 10 Key Topics


On this page
SQL, statistics, dashboards, data cleaning, and stakeholder communication now form the recurring core of data analyst interview questions. Employer-facing guides repeatedly place these skills at the center, with one widely cited guide listing 25 common questions and emphasizing JOINs, window functions, indexes, Python or R, Tableau or Power BI, and p-value concepts (X0PA’s data analyst interview guide). Another guide groups questions around statistics, SQL, dashboards, and behavioral communication, reinforcing the same message: interviewers want evidence that you can query data, validate it, test an idea, and explain what the result means to a business.
Strong preparation isn’t memorizing isolated answers. It’s learning to recognize the decision behind each prompt. A SQL question tests whether you can produce a trustworthy result. A statistics question tests whether you can distinguish evidence from assumption. A case study tests whether you can frame an ambiguous problem before choosing a method.
The 10 categories below use the same practical format: the capability being tested, realistic prompts, a difficulty tag, a repeatable answer framework, a practice exercise, and preparation advice for international and remote applicants. Technical correctness matters, but so do analytical judgment, concise communication, eligibility awareness, and a resume built for the role.
1. SQL and Database Queries
Difficulty: Core technical screen
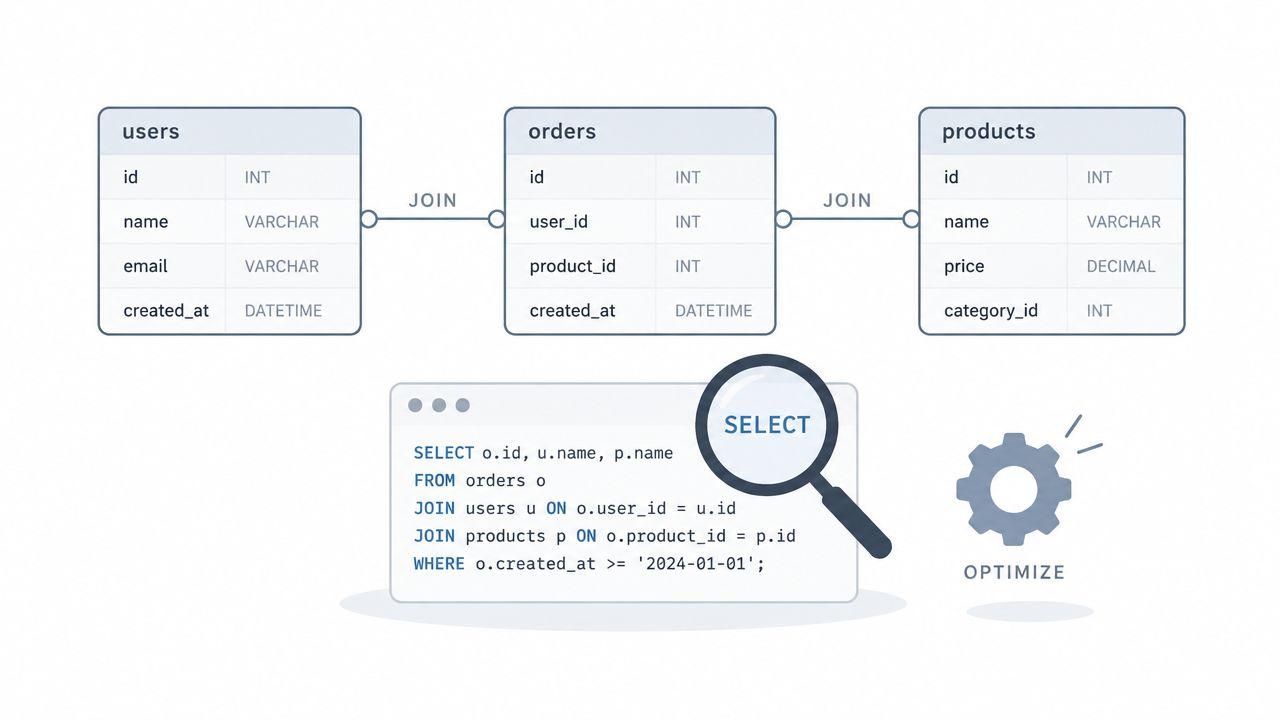
SQL questions test whether you can produce a reliable result from relational data. Interviewers commonly examine JOINs, aggregations, window functions, indexes, and query logic, often alongside expectations for Python or R and visualization tools, as outlined in X0PA’s question guide. Sample prompts include finding the top products by revenue during a specified quarter, joining customer, order, and product tables to calculate average order value by segment, or ranking employees by salary within each department.
The decision behind each prompt is data trust. Before writing code, define the expected output and its grain. Confirm which tables contain the necessary fields, how revenue is calculated, whether duplicate records may exist, how NULL values should be treated, and which date boundaries apply. Explain the join path in plain language, write a readable query, and test the logic with a small mental example.
A repeatable SQL answer framework
- Clarify the grain: Determine whether each row represents a user, order, product, or event.
- Map relationships: Locate primary keys, foreign keys, and suitable join types.
- Build the simplest correct query: Filter and join first, then aggregate, rank, or calculate window values.
- Test edge cases: Check NULLs, duplicate rows, missing dates, and tied results.
- Explain the business meaning: State which decision the output can support.
A practical exercise should combine correctness with explanation. Use a real dataset to calculate product revenue, describe every clause aloud, rewrite the query for readability, and identify where joins, filters, or aggregations could slow execution. This mirrors the SQL-first screening described in Coursera’s data analyst interview questions guide, which includes JOIN and COUNT-style data manipulation.
For international and remote applicants, tailor the resume to the listing’s SQL vocabulary. Name relevant dialects, warehouse tools, optimization work, and the business decisions your analysis supported. Research the role before practicing, then compare similar openings through JobGlance to identify recurring requirements. This gives interview answers a clear link to the employer’s work rather than a generic list of techniques.
2. Data Visualization and Communication
Difficulty: Applied communication
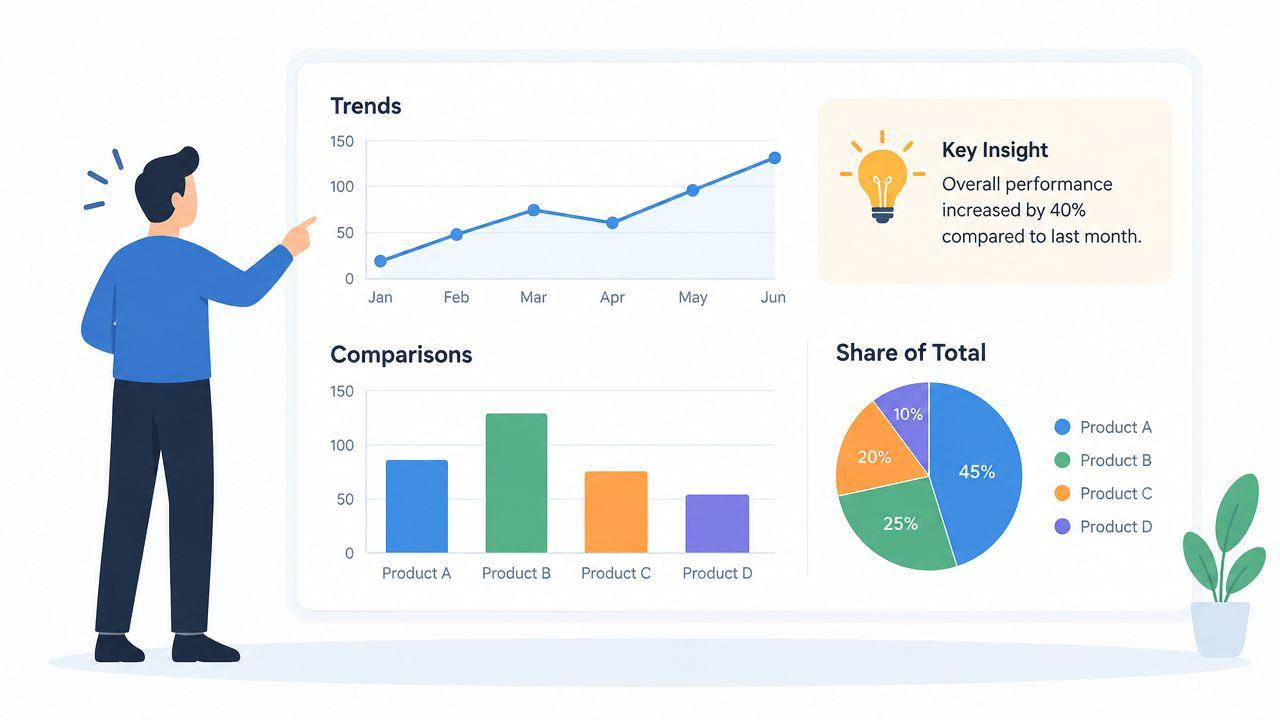
A dashboard can be technically correct and still fail if a stakeholder can’t identify the decision it supports. Visualization questions test whether you can select an appropriate chart, organize a dashboard, explain uncertainty, and adapt your message for technical and non-technical audiences. Interview guides from Indeed and LinkedIn repeatedly include dashboarding, data validation, and explaining insights to nontechnical stakeholders (Indeed’s analytics interview questions).
A prompt might ask you to design a conversion-funnel dashboard, show regional sales trends over time, or present churn findings to a chief executive. Don’t begin with a chart type. Begin with the audience and decision. An operations manager may need a filterable diagnostic view, while an executive may need a short trend narrative with a clear action.
The answer method
Describe the decision, identify the metric hierarchy, choose the visual encoding, and explain the trade-off. Bar charts work well for category comparisons, line charts for trends, and scatter plots for relationships, but the strongest answer explains why that choice fits the question. Mention scale, labeling, segmentation, refresh timing, and how you’d prevent a misleading interpretation.
Practical rule: Lead with the business question, not the software. Tableau, Power BI, Looker, or Excel only matter after you’ve defined what the audience needs to understand.
Practice by taking one raw dataset and producing two versions of the same dashboard. Make one for an analyst and one for an executive. Present each version aloud in a short, structured narrative: what changed, where it changed, why it may have changed, and what the team should do next.
Remote applicants should prepare for written communication as carefully as spoken delivery. A distributed team may first encounter your thinking in a dashboard note, analysis document, or asynchronous update. Tailor your resume with concrete examples of stakeholder presentations, dashboard ownership, and decisions influenced by your work.
3. Statistical Analysis and Hypothesis Testing
Difficulty: Foundational reasoning
Statistical questions test whether you can connect evidence to a decision. Interviewers commonly examine descriptive versus inferential statistics, correlation versus causation, normal distributions, hypothesis testing, confidence intervals, p-values, and Type I and Type II errors. These concepts recur in analyst interview guides, including Indeed’s data analyst interview questions, because they reveal whether a candidate can reason beyond a calculation.
A typical prompt might ask you to design an A/B test for a feature, interpret a p-value, explain a confidence interval, or identify weaknesses in an experiment. Start with the decision the analysis must support, then separate statistical evidence from practical value. A statistically significant result may have little effect on customers or revenue. A non-significant result may reflect limited power, noisy measurements, or an imprecise estimate rather than proof that no effect exists.
For experiment questions, answer in this sequence:
- Decision: State what action the result could change.
- Metric: Name the primary outcome and any guardrail metrics.
- Design: Describe control, treatment, randomization, duration, and assumptions.
- Evidence: Interpret the p-value, confidence interval, effect size, and uncertainty together.
- Recommendation: Weigh practical impact, cost, risk, and follow-up analysis.
Practice with a fictional feature launch. Write the null and alternative hypotheses, explain the consequences of Type I and Type II errors, identify possible bias, and define your response to an inconclusive outcome. Check for peeking at results, multiple comparisons, outliers, and survivorship bias.
International candidates should explain statistical shorthand in clear English, especially when discussing methods with colleagues from different functions. For remote interviews, practise writing the same conclusion in an analysis note before explaining it aloud. Tailor your resume to experimentation, causal reasoning, and decision support only when you can defend the method, assumptions, and limitations under questioning. Use role research and JobGlance job discovery to identify which statistical decisions the target position emphasizes.
4. Product Analytics and Metrics Design
Difficulty: Business-facing analytics
Product analytics questions test whether you can connect a product decision to a measurement system. Prompts may ask how to define retention for a subscription service, locate where mobile users abandon a funnel, or assess a pricing change. Interviewers are testing prioritization: can you separate the business outcome from the signals that explain it?
Start with the decision. Clarify who is affected, what success means, and the period for evaluation. Then choose one primary metric, supporting indicators, guardrails, and useful segments. For a subscription product, retention may reflect continuing customer value more directly than total user count. For a pricing change, revenue should be read alongside conversion, refunds, support contacts, and customer mix.
Use this decision map while answering:
- Objective: Name the product or business outcome.
- Primary metric: Select the measure closest to that outcome.
- Leading indicators: Identify earlier signals that may predict change.
- Guardrails: Monitor customer experience, quality, and operational stability.
- Segments: Compare cohorts, platforms, regions, plans, or acquisition channels.
- Decision rule: State what result would trigger action, investigation, or no change.
Practice with a fictional SaaS pricing change. Define the customer population, baseline period, exposure, retention window, revenue measure, and segments that may respond differently. Explain which metric you would reject and why. Also state what additional evidence would prevent a misleading conclusion.
For international applicants, practise explaining metric definitions without relying on local product shorthand. Remote candidates should write the framework as a short decision note before presenting it aloud, making assumptions and ownership clear for asynchronous teams. Tailor your resume to product measurement or decision support only where you can defend the choices. Research the target role, then compare its expectations with JobGlance’s product manager roles to identify whether the work centers on reporting, experimentation, or broader product decisions.
5. Data Cleaning and Exploratory Data Analysis
Difficulty: Real-world data judgment
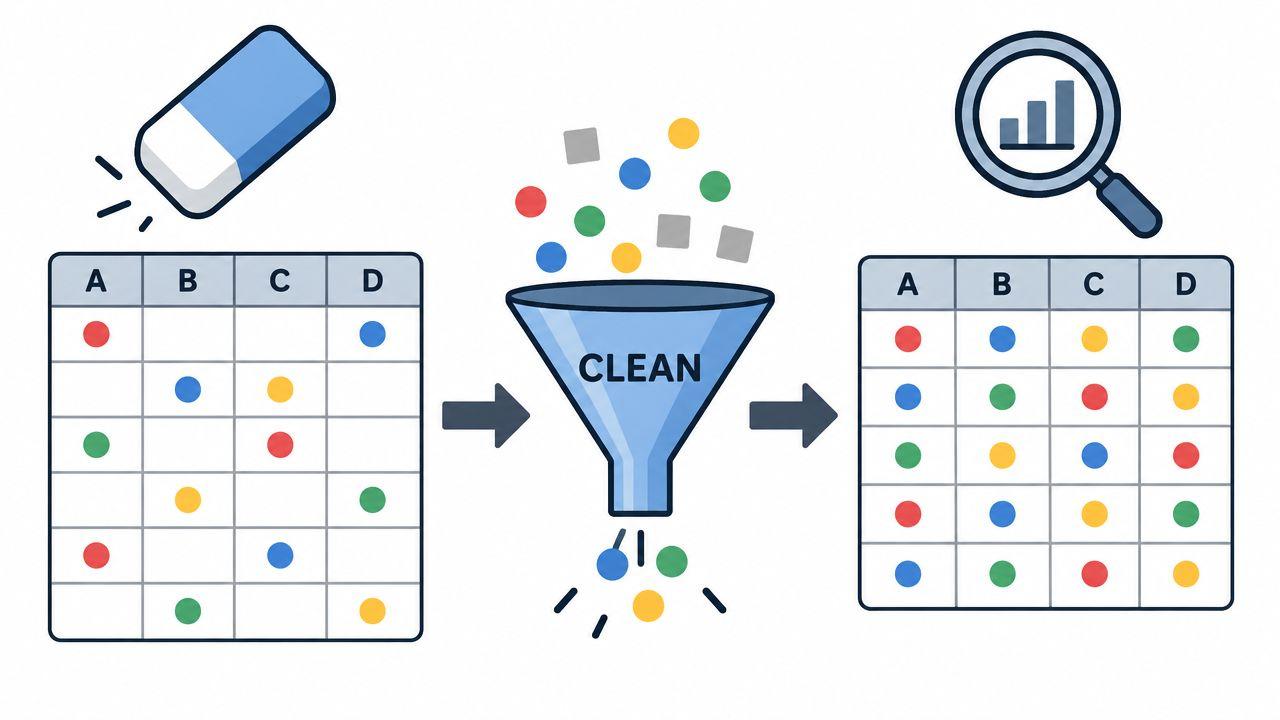
Cleaning questions test whether you can protect a business decision from misleading records. An interviewer may show missing values, duplicate rows, inconsistent categories, unusual distributions, or a sudden revenue spike. Your task is to establish what happened before changing the data. A negative revenue value may be a refund, while a one-day spike may reflect a campaign, backfill, tracking change, or genuine demand.
Start with a column-level profile: data types, record counts, ranges, central values, distinct categories, missingness, duplicates, and date coverage. Then trace suspicious observations to source-system rules and documentation. Explain which findings are confirmed, which require the data owner’s input, and which conclusions remain unsafe.
Use this decision sequence during the interview:
- Profile: Describe the fields, coverage, and quality problems.
- Validate: Test business rules and compare records with the source.
- Segment: Examine anomalies by date, region, product, channel, or source.
- Treat: Preserve, correct, exclude, or flag values based on evidence.
- Document: Record assumptions, decisions, and their effect on the analysis.
Practise with customer data containing missing contact details and inconsistent labels. Produce a short quality memo covering the observed issues, questions for the data owner, and analyses you would postpone. Repeat the exercise in SQL, Python, or R, but explain the reasoning independently of the tool.
For international applicants, define categories and quality rules without local shorthand. Remote candidates should write the findings as a concise handoff note before discussing them, including assumptions, ownership, and unresolved risks. Tailor your resume to show validation checks, anomaly investigation, source reconciliation, and documented judgment rather than claiming you “cleaned data.” Research the target role and use JobGlance to compare openings that emphasize reporting, investigation, or decision support.
6. Python and R Programming for Analytics
Difficulty: Role-dependent technical round
Python and R questions focus on practical analytical programming rather than software-engineering algorithms. Interviewers may ask you to manipulate a DataFrame, calculate a moving average, reshape a multi-level dataset, identify outliers, or create a visualization. Current preparation guidance combines Python for analysis with SQL, statistics, A/B testing, and dashboarding, suggesting that employers increasingly value end-to-end execution rather than isolated tool familiarity (Dataquest’s data analyst interview preparation).
A good answer starts by stating the input and desired output. Then write clear, testable code. Explain how you’d handle empty data, missing values, duplicate keys, unexpected types, and inefficient operations. Pandas groupby and merge operations, R’s dplyr workflow, vectorization, functions, and readable naming matter more than clever syntax.
A focused coding drill
Take a time-series dataset and produce a moving average, a grouped summary, and a chart. First write the solution for correctness. Then add checks for missing dates, null measures, and duplicate timestamps. Finally, explain which parts you’d move into reusable functions if the analysis became a recurring report.
“Readable code is analytical evidence.” If another analyst can’t inspect your transformations, they can’t confidently challenge or reuse your conclusion.
Don’t claim Python and R equally on your resume unless you can work through a live problem in each. Match the listing’s language, name libraries such as pandas, SciPy, statsmodels, dplyr, matplotlib, or ggplot2, and connect the code to an outcome. Remote teams especially value reproducibility because handoffs happen through notebooks, repositories, and written documentation rather than desk-side explanation.
7. Case Studies and Business Problem-Solving
Difficulty: Integrated decision exercise
Case studies combine SQL, statistics, metrics, communication, and product thinking in one ambiguous prompt. You might be told that churn rose, conversion weakened, or retention declined and asked to diagnose the cause. The interviewer isn’t looking for a magical answer from incomplete information. They’re evaluating whether you can scope the problem, ask useful questions, prioritize analyses, and recommend an action.
Use PACE: Plan, Analyze, Construct, Execute. Plan by defining the metric, time frame, population, business objective, and constraints. Analyze through segmentation, funnel steps, cohorts, trends, and data-quality checks. Construct one or two clear insights. Execute with recommendations ranked by impact, feasibility, risk, and learning value.
Practice scenario
A mobile app’s retention is falling. Ask whether retention is measured by returning users, active use, or a paid event. Segment by acquisition channel, platform, geography, signup cohort, and user behavior. Check whether tracking changed before creating a product explanation. Then propose a test or operational response and state what result would change your recommendation.
A strong answer connects every analysis to a decision. “I’d examine retention by cohort” is incomplete. Explain what a cohort pattern would tell you, which team would act on it, and what you’d do if all cohorts declined together.
Resume tailoring should mirror this structure. Show the original business question, the analysis you chose, the stakeholders involved, and the result. If the listing uses terms such as funnel, cohort, churn, experimentation, or root-cause analysis, use them where they accurately describe your experience. For international and remote applicants, prepare examples of resolving ambiguity in written channels and coordinating decisions across locations.
8. Data Pipeline and ETL Knowledge
Difficulty: Intermediate to advanced
Pipeline questions test whether you can connect business requirements with dependable data delivery. Interviewers may ask you to design a daily process, troubleshoot a delayed refresh, handle a schema change, or choose between batch and streaming. The decision is usually about latency, cost, complexity, reliability, and ownership, not about claiming to be a data engineer.
Start by defining the output and its users. A planning dashboard may work with batch data, while an operational alert may need lower latency. Trace the path from source systems through extraction, transformation, validation, orchestration, and delivery. Explain how you would handle duplicates, late-arriving records, schema evolution, failed jobs, and incomplete results. State who owns each dependency and how consumers know the output is trustworthy.
Use PACE to structure the answer
- Plan: Define the business requirement, refresh expectation, source owners, and output contract.
- Analyze: Map joins, business rules, deduplication, dependencies, and quality checks.
- Construct: Choose batch or streaming, then specify retries, idempotency, monitoring, and backfills.
- Execute: Describe alerts, failure communication, recovery, and how users access the trusted data.
Practice by designing a marketing dashboard pipeline. Add a case where customer data arrives late. Explain how you would detect the delay, prevent partial reporting, record the limitation, and decide whether to rerun or publish a qualified result.
For infrastructure-heavy roles, review JobGlance’s data engineer roles to recognize adjacent terminology. Tailor your resume to show the systems you used, such as dbt models, Airflow dependencies, warehouse transformations, monitoring checks, or reliable reporting processes. International and remote applicants should also prepare a written example of coordinating a pipeline issue across locations and time zones.
9. Domain Knowledge and Business Acumen
Difficulty: Contextual reasoning
Domain questions test whether you can translate an industry’s business model into analytical requirements. The same metric can mean different things in SaaS, e-commerce, fintech, airlines, or marketplaces. A subscription company may care about retention and recurring revenue. A marketplace may need to balance buyer demand with seller quality. A fintech team may prioritize fraud prevention while protecting approval rates and customer experience.
Before the interview, research how the company makes money, who its customers are, what its key operational constraints look like, and which competitors shape its strategy. Don’t memorize industry jargon without understanding the mechanism behind it. If you mention customer lifetime value, explain the behaviors and costs that influence it. If you discuss churn, distinguish voluntary cancellations, involuntary failures, and customers who stop using the product.
Turn research into an answer
Choose a business objective, identify the relevant unit of value, define leading and lagging indicators, and describe the segments that could hide the pattern. For an e-commerce marketplace, seller success might involve sales, fulfillment quality, repeat demand, and dispute rates. For a fintech product, fraud prevention should be evaluated alongside false positives and customer friction.
Practice by selecting one target company and writing a one-page metric map. Include its customer, revenue mechanism, acquisition path, retention risk, and operational bottleneck. Then prepare questions that show you’ve researched the business without pretending to know internal data.
For an international or remote application, domain preparation also helps you ask about regional ownership, regulatory constraints, time-zone coverage, and collaboration practices. Put relevant sector experience near the top of your resume, not buried in a project description. Employers can then see why your analytical judgment will transfer quickly.
10. Interview Preparation and Technical Communication
Difficulty: Cross-round performance
Interviewers assess how you make decisions while solving, not only whether the final query or calculation is correct. They listen for clear assumptions, useful clarifying questions, responses to uncertainty, and reasons for choosing one method over another. Coursera’s data analysis interview preparation guide highlights practice areas including messy-data cleaning, accuracy checks, dashboard metric prioritization, conflicting stakeholder requirements, and the speed-versus-accuracy trade-off in production.
For a technical prompt, state your plan, identify edge cases, work through the solution, and connect the result to a business decision. Think aloud selectively rather than narrating every keystroke. For behavioral questions, use STAR: Situation, Task, Action, Result. Give most of the answer to your actions, then explain the outcome and what you learned.
Build a compact story bank
Prepare examples covering an ambiguous request, a data-quality failure, stakeholder disagreement, a difficult trade-off, and a measurable business outcome. A strong story can support several prompts, but each answer should match the question. If evidence is missing, explain how you would investigate instead of claiming certainty.
Use a peer, mentor, or mock interview platform for practice. Record a SQL walkthrough and a case response, then remove jargon, tighten the opening, and check that the recommendation is easy to find. International applicants should rehearse concise explanations of work authorization and relocation needs. Remote applicants should prepare examples of written updates, asynchronous decisions, and collaboration across time zones.
Tailor your resume before practicing. Match accurate terms from the listing, bring relevant projects forward, and make results easy to verify. Compare data analyst roles on JobGlance to see how employers describe similar analytical work, then research each target role before selecting practice questions. This links interview preparation to both resume evidence and the decisions the employer is likely testing.
10-Point Comparison of Data Analyst Interview Topics
| Category | 🔄 Implementation complexity | ⚡ Resource requirements | ⭐ Expected outcomes | 📊 Ideal use cases | 💡 Key advantages |
|---|---|---|---|---|---|
| SQL and Database Queries | Medium→High, query logic & optimization | Low, DB access & sample data | ⭐⭐⭐⭐, accurate data retrieval & aggregation | Ad‑hoc reporting, cohort/LTV calculations, joins | Directly applicable to daily analysis; objective scoring |
| Data Visualization and Communication | Medium, design judgment + storytelling | Medium, viz tools (Tableau/Power BI) & samples | ⭐⭐⭐⭐, high stakeholder impact | Dashboards, executive summaries, trend communication | Translates analysis for non‑technical audiences |
| Statistical Analysis and Hypothesis Testing | High, math & inference rigor | Medium, statistical tools and clear data | ⭐⭐⭐⭐, reliable causal insights | A/B tests, experiment design, power/sample sizing | Ensures analytical rigor; reduces wrong decisions |
| Product Analytics and Metrics Design | Medium, product thinking + metrics design | Medium, product/event data & tooling | ⭐⭐⭐⭐, strategic product insights | Funnel analysis, retention, KPI frameworks | Connects metrics to business outcomes and strategy |
| Data Cleaning and Exploratory Data Analysis | Medium, detective work & validation | Medium, messy datasets, SQL/Python/R | ⭐⭐⭐⭐, improves data reliability for analysis | Pre‑analysis, anomaly detection, data profiling | Mirrors day‑to‑day work; uncovers root‑cause issues |
| Python/R Programming for Analytics | Medium, coding & library knowledge | Medium, dev environment and libs (pandas/dplyr) | ⭐⭐⭐⭐, flexible, automatable analyses | Complex transformations, custom modeling, automation | Enables analyses beyond SQL; reproducibility & automation |
| Case Studies and Business Problem‑Solving | High, integrates multiple disciplines | Low→Medium, case materials and time | ⭐⭐⭐⭐⭐, closest to real job impact | Cross‑functional strategy, prioritization, end‑to‑end problems | Shows holistic problem‑solving and prioritization skills |
| Data Pipeline and ETL Knowledge | Medium→High, systems & orchestration | High, infra, orchestration tools, engineering | ⭐⭐⭐⭐, scalable, reliable data delivery | Data warehousing, ETL design, freshness troubleshooting | Prevents downstream errors; enables scale and collaboration |
| Domain Knowledge and Business Acumen | Medium, industry learning & context | Low→Medium, research and experience | ⭐⭐⭐⭐, faster, more relevant insights | Industry‑specific metrics (SaaS, e‑commerce, fintech) | Accelerates impact; improves metric relevance |
| Interview Preparation & Technical Communication | Variable, depends on role depth | Low, practice time and mock interviews | ⭐⭐⭐⭐⭐, higher interview success rate | Interviews, stakeholder presentations, code walkthroughs | Clarifies thinking; often decisive in hiring decisions |
Turn Practice Into Interview Readiness
Start with a gap diagnosis, not a random question list. Divide the target role into SQL, statistics, Python or R, metrics, data quality, visualization, and communication. Mark each area as one of three things: comfortable without notes, accurate but slow, or unable to explain clearly. The last two categories deserve timed practice because interviews test both knowledge and delivery.
Build a sequence that resembles the work itself. Begin with a SQL exercise that extracts and validates data. Follow it with a short EDA task, a metric-definition prompt, and a statistics interpretation question. Finish with an integrated case where you must move from an ambiguous business request to a recommendation. Current preparation guidance from Coursera recommends timed SQL exercises, portfolio dashboards built on real-world data, and mock technical interviews involving live SQL or Python and data-pipeline whiteboarding (Coursera’s interview prep guide).
Your answers should show a repeatable reasoning process. Define the objective, clarify the metric, inspect data quality, segment before diagnosing, state assumptions, interpret uncertainty, and connect the result to an action. Practice saying the “so what” in one sentence after every exercise. That habit separates a technically correct response from a useful business answer.
Tailor your resume to each listing before you apply. Surface the SQL dialect, warehouse, BI tools, programming libraries, experimentation methods, and stakeholder work the employer requests. Rewrite project bullets around decisions and outcomes rather than activities. A resume that says you built a dashboard is weaker than one that explains which business question it answered, which metrics it brought together, and what decision it supported.
International and remote applicants need one more screening layer. Check whether the role supports sponsorship, relocation, or work from anywhere before investing hours in an application. “Remote” may describe work inside one country rather than global eligibility, so treat location and authorization as separate requirements. A technically strong application still fails if the employer can’t legally hire you where you live.
JobGlance can support that workflow without replacing your judgment. Its Smart Match scores roles against your resume, while the per-job view highlights matched and missing keywords. The ATS Resume Builder checks resumes against five ATS requirements, rebuilds them in single-column templates, tailors them to listings on the platform, and exports a text-preserving PDF. Career Gap Analysis aggregates recurring skill gaps across saved roles, which can show whether SQL, dashboarding, experimentation, or communication keeps appearing in the jobs you want.
The platform aggregates 50,000+ active roles from 100+ job sites, refreshes the database every 24 hours, and purges expired roles within 24 hours (JobGlance’s public site). Dedicated visa-sponsorship and work-from-anywhere filters narrow eligibility before Smart Match ranks the remaining roles. Use JobGlance Role Insights to research what data analyst listings ask for, then compare those requirements with your resume and practice plan. If a role looks promising, Deep Company Research can help you examine listing legitimacy, company stability, culture, and interview difficulty with confidence levels and cited evidence.
Finish preparation with one timed SQL problem, one statistics explanation, one dashboard critique, and one case study. Prepare concise STAR examples from your actual experience, including measurable results where you have them. Then verify the role’s location and sponsorship conditions before you apply, because readiness includes eligibility as well as technical skill.
JobGlance brings resume-based Smart Match, highlighted missing keywords, ATS Resume Builder, Career Gap Analysis, company research, and dedicated visa-sponsorship and remote filters into one job-search workflow. Use it to find data analyst roles that fit your skills, identify the gaps behind recurring interview questions, and tailor your next application with evidence. Visit JobGlance and turn your interview preparation into a more focused search.
Keep reading


